

Before an agent explains why your KPI moved, agree what the KPI means
Salesforce is buying Loops to explain why metrics change, and Tableau Knowledge will feed agents governed semantics in Winter '27. Both bets only pay off if your CRM metrics have one agreed definition.
Two pieces of Salesforce analytics news landed this week, and I think they belong in the same conversation.
On 12 October Salesforce signed a definitive agreement to acquire Loops, an AI analytics platform that monitors business performance and explains why key metrics change. On 14 October, according to WeekCRM's report of a Salesforce LinkedIn post, Salesforce announced Tableau Knowledge for Winter '27, which lets Tableau users build knowledge graphs for AI agents from the metadata and semantics they already have in Tableau, combined with unstructured data.
Put together, the direction is clear. Salesforce wants agents that do not just show you a number but tell you why it moved and what to do next. As an architect, my reaction is simple: that only works if everyone agrees what the number means in the first place.
What we actually know
From Salesforce's announcement, Loops continuously monitors business performance, explains why key metrics change and surfaces opportunities to improve, using machine learning models. It has headless, agentic capabilities and can be triggered directly from Slack and email to watch key performance indicators, spot trends and anomalies, and surface what is driving change. After the deal closes, Salesforce plans to bring the technology and team into Tableau.
A few details are worth getting right, because coverage has been loose. AI News Today points out that the release contains no price or terms. The figure of around $30 million in some coverage is an outside estimate, not a Salesforce disclosure. The release says the deal should close in early November of Salesforce's fiscal year 2027, and since that fiscal year began in February 2026, that means November 2026, not 2027. It is also a signed agreement, not a completed acquisition, and it is subject to customary closing conditions.
AI Tech Edition adds the mechanism, citing Loops's own product page. Loops tracks KPIs, checks candidate explanations such as marketing, product performance and bugs, seasonality, population shifts and experiment impacts, then ranks them by how much each one affected the metric. It credits proprietary causal inference models for that ranking.
On Tableau Knowledge, WeekCRM reports that teams can curate and enrich the knowledge graphs, and that Salesforce describes the result as governed knowledge that agents use to deliver more accurate insights. The post gave no plan, pricing or regional availability details.
Why this is a CRM data problem, not an analytics problem
Imagine Loops running against your pipeline and posting in Slack that win rate dropped this month and the main driver is a shift in lead source mix. That is useful only if "win rate" is calculated the same way everywhere. In a lot of Salesforce orgs I have seen, it is not. One dashboard counts closed-lost opportunities that never left the first stage. Another excludes them. Sales leadership uses one version, finance uses another, and both are "right" in their own report.
A human analyst usually knows which version they are looking at. An agent that ranks causes and pushes them into Slack will present its answer with confidence, to people who may not know which definition it used. If the definitions disagree, you get a well-argued explanation of a number half the room does not recognise.
That is why I read Tableau Knowledge as the more important announcement for most teams, even though the acquisition got the headlines. A governed layer of definitions that agents read from is exactly what makes an explanation engine trustworthy. But it is only as good as what you put in it.
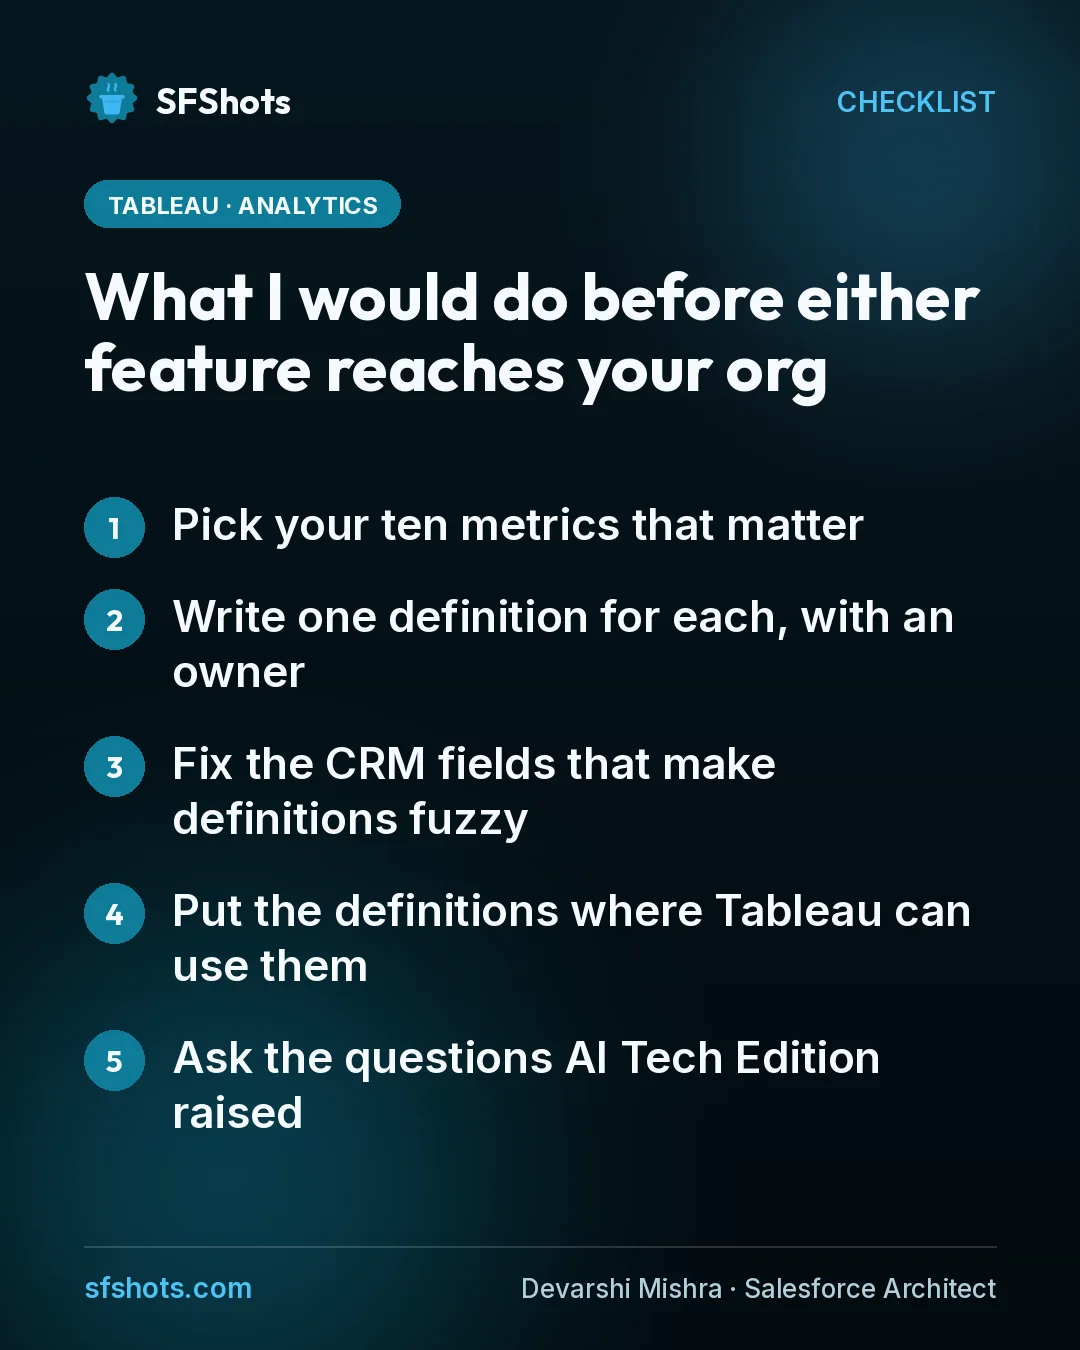
What I would do before either feature reaches your org
- Pick your ten metrics that matter. Pipeline created, win rate, average deal size, sales cycle length, churn, net revenue retention, case backlog, first response time and similar. Not every report, just the ones leadership argues about.
- Write one definition for each, with an owner. State the objects, filters, stages and date fields used. Get sales, finance and service to sign off. Disputes surface here, which is the point.
- Fix the CRM fields that make definitions fuzzy. Inconsistent stage use, free-text loss reasons and missing lead sources will become "causes" an agent finds. Clean the inputs before a model starts ranking them.
- Put the definitions where Tableau can use them. If you already use Tableau semantics, that is the natural home. If not, start with a shared document and plan the move when Winter '27 details are published.
- Ask the questions AI Tech Edition raised. How is the causal ranking shown to users? What data does Loops need read access to when it runs from Slack and email? Does it come inside existing Tableau licences or as a separate product? Salesforce's announcement does not answer these, and the answers decide cost and audit exposure.
The takeaway for CRM and RevOps teams
Agentic analytics moves the hard question from "what happened?" to "why did it happen?" That is a real step forward, and Loops plus Tableau Knowledge suggests Salesforce is serious about it. But an agent explaining a metric is only as reliable as the definition underneath it.
The cheapest preparation is not technical. Get your leadership to agree, in writing, what your core revenue and service metrics mean, and fix the CRM fields that feed them. Do that before November, and when these tools arrive, the explanations they push into Slack will be about your business rather than about your reporting inconsistencies.